There is a strong connection between resourcing of remote schools and student outcomes, writes
John Guenther*
The findings presented in this article are based on independent research conducted by the Cooperative Research Centre for Remote Economic Participation’s (CRC-REP) Remote Education Systems (RES) project.
This research was designed to uncover ways to improve outcomes for remote Aboriginal and Torres Strait Islander students. It commenced in 2011 and concludes in June 2016. It is the largest project of its kind ever to be undertaken.
While the team’s qualitative research has focused mainly on three jurisdictions – the Northern Territory, South Australia and Western Australia – our quantitative analysis has drawn on national data from My School and the Australian Bureau of Statistics (ABS) Census. A summary of the project’s qualitative findings is available in a downloadable technical report (Guenther, 2015b).
The arguments presented here are based largely on quantitative data gleaned from My School (ACARA, 2016). On the basis of the evidence, I contend: 1) that schools with higher proportions of local staff produce better outcomes; 2) they do so partly because they are better resourced; and 3) that in the Northern Territory, (which has about half of all very remote schools) resourcing makes it more difficult to employ more local staff. I acknowledge that there is a complex array of factors at play here and I am not suggesting that simply adding more local staff or more money to schools will improve outcomes. However, I will tackle each of these assertions and show some of the evidence on which I base these claims.
Local staff and very remote school outcomes
Figure 1 shows how the ratio of non-teaching to teaching staff in very remote schools changes with attendance. Schools with a ratio less than 1:1 have on average, an attendance rate of between 68 and 69 per cent. As the ratio increases to above 2.5:1 the attendance rate increases to about 79 per cent. While I am careful not to make assertions about causality, the relationship between the two variables is strong. It should be noted that My School defines non-teaching staff as any staff that are not qualified teachers – those staff are not necessarily only teacher assistants. They may not be all local staff, but our analysis of Census data shows that the non-teaching workforce is predominantly local (Aboriginal and Torres Strait Islanders) in very remote schools. We have found that similar relationships exist with academic performance (NAPLAN) variables (Guenther & Disbray, 2015).
Figure 1. Average School Attendance Rates for Very Remote Schools with >80% Aboriginal or Torres Strait Islanders compared with ratio of non-teachers to teachers, 2008-2015
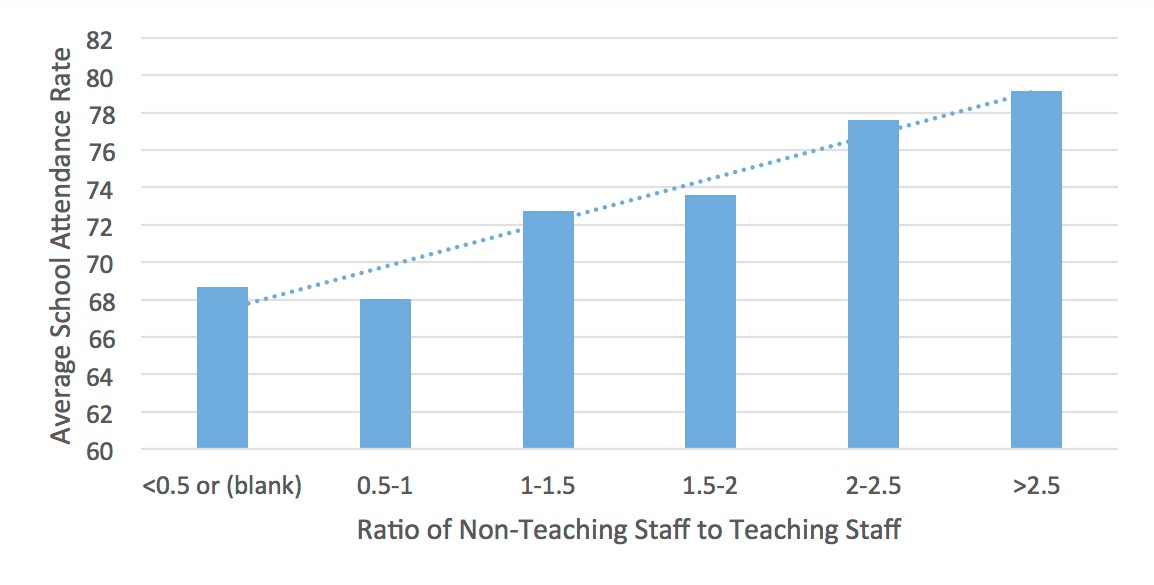
Source: My School (ACARA 2016)
Resourcing and very remote school outcomes
Figure 2 shows how net recurrent income per student changes with school attendance. Again, while I am cautious about causality, there is a strong relationship between the variables. Schools with greater recurrent per student funding have better attendance outcomes.
Money does make a difference, and while I have shown attendance data here, the relationship also applies to academic outcomes (Guenther, 2015a).
Figure 2. Average School Attendance Rates for Very Remote Schools with >80% Aboriginal or Torres Strait Islanders compared with average per student net recurrent income, 2009-2014
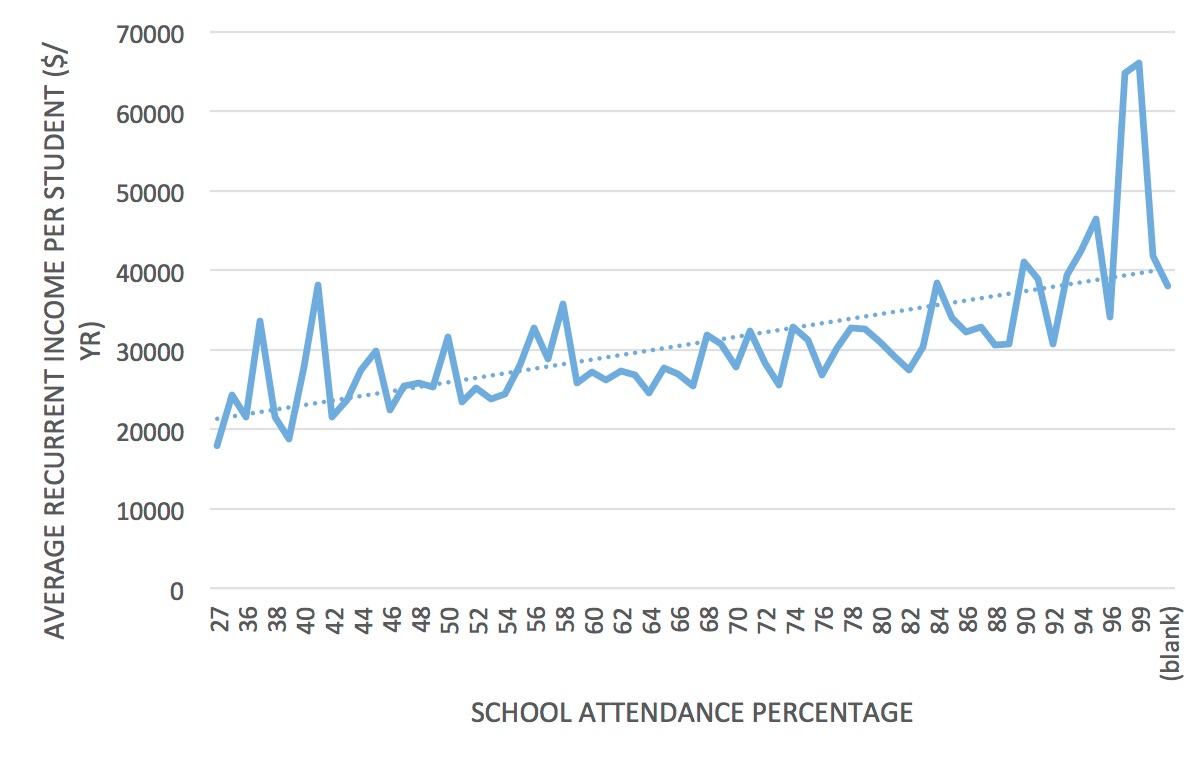
Source: My School (ACARA 2016)
Very remote school resourcing trends
Figure 3 shows trends for per student recurrent funding by year and jurisdiction. I have separated the Northern Territory into government (NT- G) and non-government (NT-N) sectors deliberately to show the diverging trends.
On its own, this chart does not tell a complete story. For example, while Queensland schools have similar levels of per-student recurrent spending, attendance rates in very remote schools there are among the highest of all jurisdictions. However, in 2015 there were only 15 Very Remote schools with more than 80 per cent ATSI students, compared with 81 in the Northern Territory. Enrolments in Queensland were on average 2.5 times higher per school than in the Northern Territory. The two jurisdictions are quite different.
However, the point to take from this chart is that while other jurisdictions have increased per student resources to very remote schools considerably since 2009 (2010 reporting year), the Northern Territory has kept its resourcing in actual dollars about the same.
Non-government schools in the Northern Territory on the other hand, have increased per student recurrent funding by about 30 per cent. In the period between 2009 and 2012 when per student funding was about the same in the two sectors, attendance rates were tracking at about the same levels (if not a little lower for the non-government sector).
In the last two years a gap between the two sectors has opened up so that in 2015 non-government schools had attendance rates six percentage points higher than comparable (very remote schools with greater than 80 per cent ATSI students) government schools.
Figure 3. Average recurrent per student income for Very Remote Schools with >80% Aboriginal or Torres Strait Islanders by jurisdiction and year reported in My School*
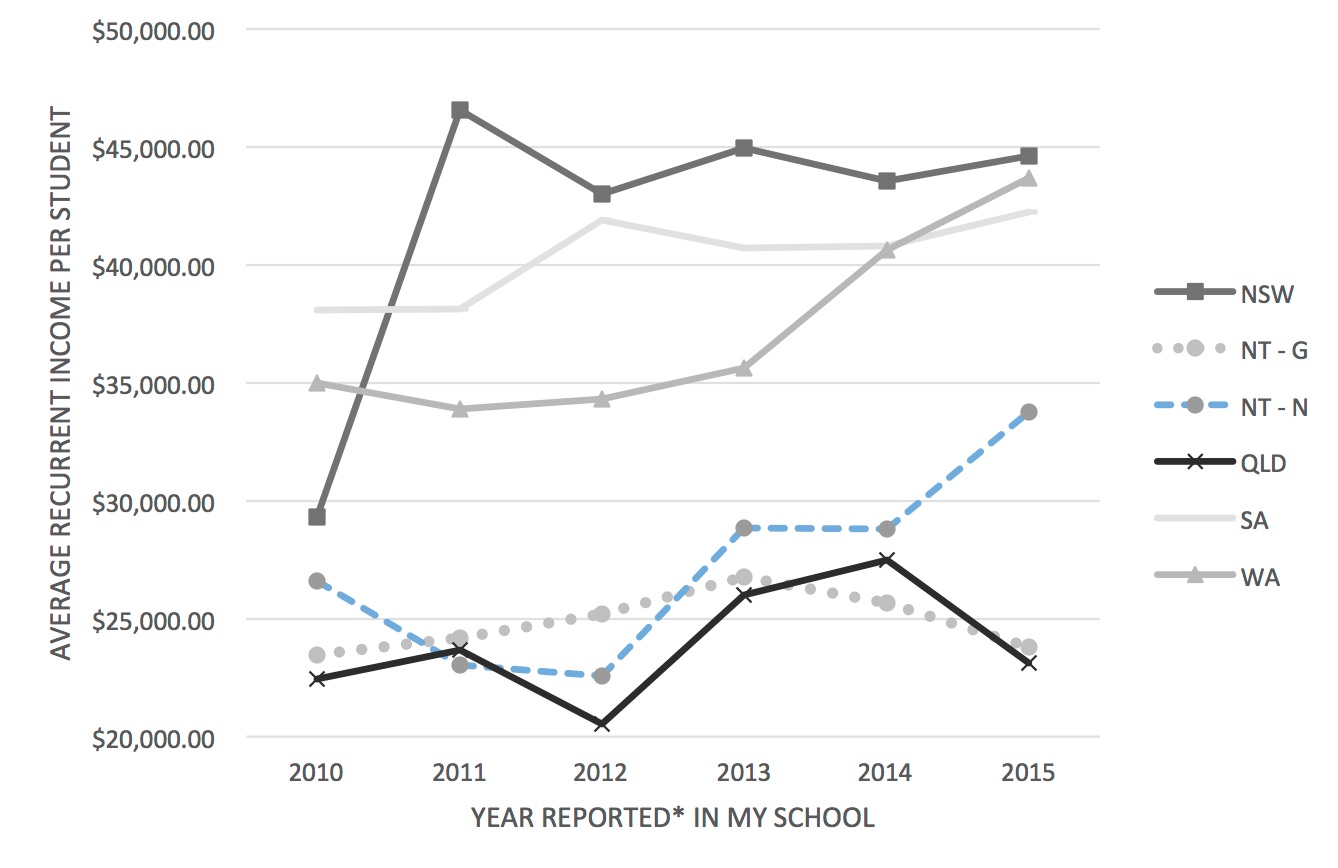
Source: My School (ACARA 2016)
*report year is for previous year e.g. school finances for 2014 are reported in the 2015 release of My School data
Conclusions
The analysis I have presented here demonstrates the link between attendance and the proportion of local staff in remote schools, and the level of per-student funding for very remote schools with more than 80 per cent Aboriginal and Torres Strait Islander students.
Higher levels of local staff employment are of course enabled by higher levels of funding. In general NT schools lag behind other jurisdictions in the employment of Indigenous non-teaching staff, and this in turn reflects in lower levels of school attendance.
While there are several explanations for these relationships, the simple point of this analysis is to demonstrate that money does matter for very remote schools and it does make a difference both to the capacity of communities both in terms of local employment, and importantly in terms of student outcomes.
*
John Guenther is the Principal Research Leader, Remote Education Systems Project, Flinders University and the Cooperative Research Centre for Remote Economic Participation

References
ACARA. (2016). My School. Retrieved March 2016, from
http://www.myschool.edu.au
Guenther, J. (2015a).
Conspiring to inspire community aspirations through remote education. Paper presented at the Australian Association for Research in Education annual conference, Fremantle. 30 November 2015. Retrieved from
https://www.academia.edu/21013462/
Conspiring_to_inspire_community_aspirations_through_remote_education
Guenther, J. (2015b).
Overview of Remote Education Systems qualitative results. CRC-REP Working Paper. CW025, Ninti One Limited. Retrieved July 2015 from
http://www.crc-rep.com.au/resource/
CW025_RemoteEducationSystemsQualitativeResults.pdf.
Guenther, J., & Disbray, S. (2015).
Why local staff matter in very remote schools. Paper presented at the Australian Association for Research in Education annual conference, Fremantle. 1 December 2015. Retrieved from
http://www.academia.edu/19290693/
WHY_LOCAL_STAFF_MATTER_IN_VERY_REMOTE_SCHOOLS